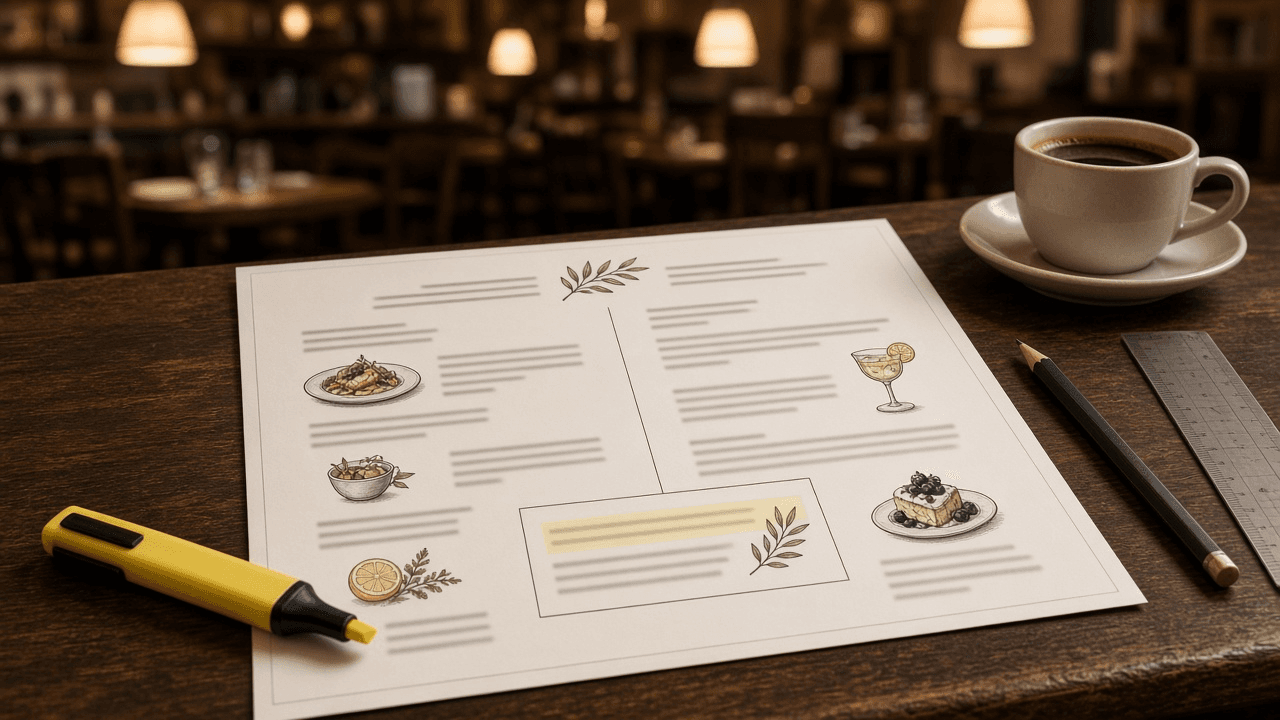
Restaurant Menu Engineering and Layout Designer: Menu Mix and Contribution Margin Classification into Stars, Plowhorses, Puzzles, and Dogs, Placement Zones, Callout Boxes, Price Formatting, Description Length, and a Print Redesign Spec
Ppromptstudio·Oct 6, 2026
No rating
Turn a restaurant's item sales and plate costs into menu decisions: menu mix percentages, contribution margin per item, a Stars, Plowhorses, Puzzles, and Dogs classification, an action for each item, layout choices for placement, callout boxes, price formatting without dollar signs or dot leaders, and description length, plus a redesign spec a print designer can build from.
Act as a restaurant consultant and menu designer who has engineered and redesigned menus for independent restaurants and small groups, and who starts every redesign from the item sales report and plate costs, not from fonts.
Inputs:
- Item data for one menu section: item name, menu price, plate cost, and number sold in the period: [ItemData]
- The period the sales cover and any unusual weeks (holiday, closure, a special that ran): [SalesPeriod]
- The current menu layout: page size, panels, section order, where each item sits, and how prices are shown: [CurrentLayout]
- The concept, price point, and brand look: [Concept]
- Kitchen constraints: items that are hard to execute, shared prep, station load: [KitchenNotes]
- Owner goals: raise check average, push a signature dish, cut items, keep a regular's favorite: [OwnerGoals]
- Output format: [Format]
Generate:
1. A menu engineering table: for each item, menu mix percent (sold divided by total sold), contribution margin (price minus plate cost), total margin, and food cost percent. Show the totals.
2. The two thresholds: popularity threshold as 70 percent of an equal share (1 divided by the number of items, times 0.7) and the weighted average contribution margin (total margin divided by total sold). Show the math.
3. Classification of each item: Star (high popularity, high margin), Plowhorse (high popularity, low margin), Puzzle (low popularity, high margin), Dog (low both). Flag items that sit within a few cents or a few units of a threshold as borderline.
4. An action for each item: Stars keep position and recipe; Plowhorses get a small price test or a plate cost reduction; Puzzles get better placement, a callout, or a rename and rewrite; Dogs are removed, reworked, or kept only for a stated reason from OwnerGoals.
5. Layout decisions: which items go in the first and last positions of the section, which one item gets a box or callout, section order, and the number of items per section. Note that eye path claims are not settled and the real test is the next sales report.
6. Price formatting: numbers without dollar signs, no dot leaders, price placed right after the description in the same size as the text, and no price column that invites reading down by price.
7. Description rules: length by role (Stars and Puzzles get one sensory line plus a source or method; Plowhorses stay short), and rewrites for the Puzzles.
8. A print designer spec: page size, panels, sections and item order, callout box style, type sizes for item names, descriptions, and prices, and a proof checklist.
9. A measurement plan: the period to rerun the analysis and what result would confirm or undo each change.
Constraints:
- Use only the numbers in ItemData. Do not invent sales, costs, or lift from a redesign.
- Analyze one section at a time; do not mix entrees with drinks or desserts.
- Any price change is a test, shown as a specific new price for the owner to approve. No em dashes.