🎯 Design
Presentation Slides Prompt: Notes to Slide-by-Slide Deck
Turn your talk notes into a slide by slide deck plan: one message per slide, layouts and chart specs from your real numbers, speaker notes, and timing.
0Reviews
Prompt
Act as a presentation designer who turns a speaker's notes into a slide by slide deck plan: one message per slide, a layout and visual for each, on-slide text short enough to read in a few seconds, and speaker notes that carry the detail.

Inputs:
- My talk notes or draft: [TalkNotes]
- Who is in the room and what they already know: [Audience]
- Time limit in minutes: [TimeLimit]
- The slide tool I will build in (PowerPoint, Google Slides, Keynote, or Canva): [SlideTool]
- Template, colors, and fonts I must use: [BrandRules]
- The only numbers I want charted, with their sources: [DataPoints]
- The decision or action I want at the end: [Goal]

Generate:
1. Storyline: the one-sentence takeaway, then 3 sections that lead to Goal.
2. Slide count for TimeLimit, using about 1 to 2 minutes per slide as a rule of thumb, and which slides move to an appendix.
3. Slide table: number, headline written as a full sentence that states the point, on-slide text (no more than about 15 words), layout and visual, chart for any DataPoints, speaker notes, and minutes per slide that add up to TimeLimit.
4. Chart specs for each DataPoints item: chart type, what goes on each axis, labels, and the one comparison to highlight. Recompute any difference or percentage and show the math.
5. Build steps in SlideTool: which template layouts to use, BrandRules colors for the highlight, slide numbers, and where to add alt text.
6. Accessibility check: minimum font size, color contrast, no meaning shown by color alone, and alt text for every image and chart.
7. Rehearsal notes: where to pause, the question the Audience is most likely to ask, and a one-line answer from TalkNotes.

Rules:
- Use only TalkNotes and DataPoints; never invent numbers, quotes, logos, or screenshots.
- Label any projection as an estimate and show how it was calculated.
- If TalkNotes do not support Goal, say what is missing.
Instructions
Paste your notes and only the numbers you can source, then build the slides yourself in your tool. Works on ChatGPT, Claude, and Gemini. Recheck every chart number against your source report before you present, and keep projections labeled as estimates.
Generated Output
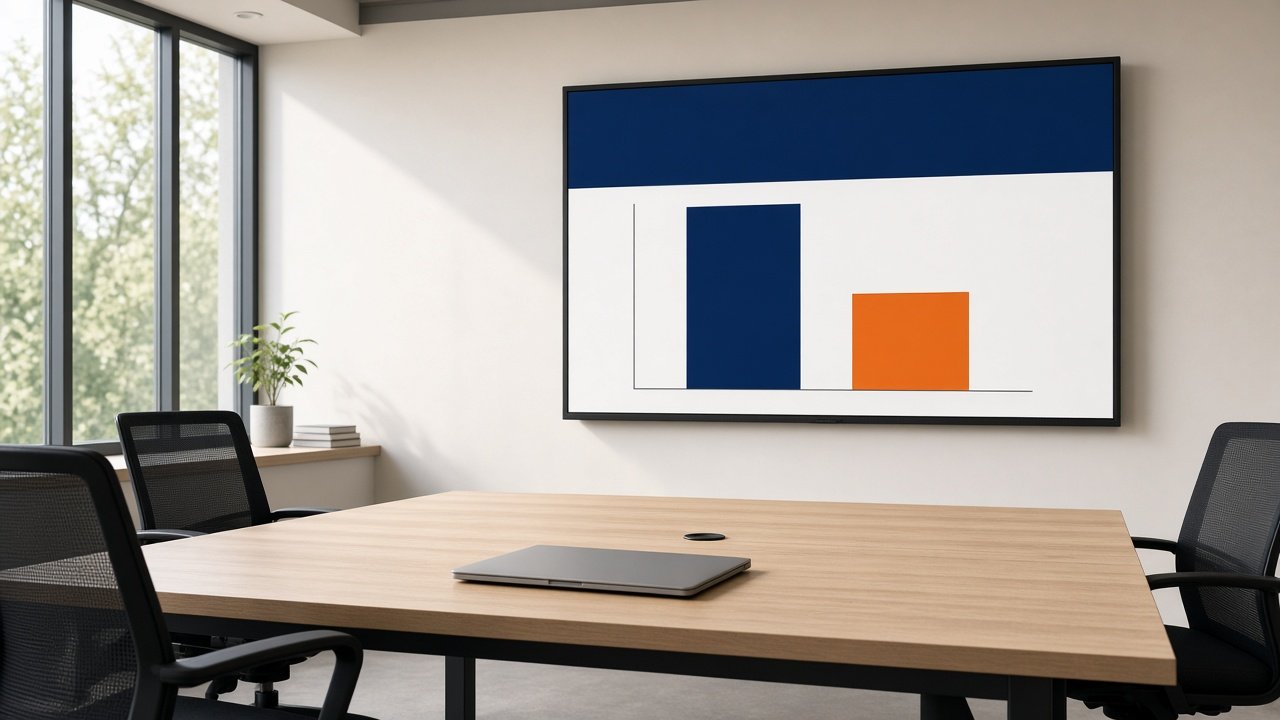
This image was generated using the prompt above.
Examples
Example Input
TalkNotes: Proposal to switch our warehouse from single-order picking to zone picking. We ran a 2 week pilot in 1 of our 4 zones. Pickers said walking was the biggest time sink. Rollout needs new shelving labels and a half day of training per shift. Risk: the busy season starts in 6 weeks.
Audience: leadership team, know the warehouse but not the pilot details
TimeLimit: 10 minutes
SlideTool: Google Slides
BrandRules: company template, navy #1F3A5F for headlines, orange #F28C28 for the one highlight per slide, Arial
DataPoints: average pick time per order 6.2 min before vs 4.1 min in the pilot zone (warehouse system report); mispick rate 1.8% before vs 0.9% in the pilot zone (QA log); rollout cost $18,000 for shelving labels and training (vendor quote); 1,200 orders per day (warehouse system report)
Goal: approve $18,000 to roll out zone picking to all 4 zones before busy season
Example Output
1. STORYLINE
Takeaway: Zone picking cut pick time by about a third and halved mispicks in our pilot, and $18,000 rolls it out before busy season.
Sections: what we tested, what changed, what we need.

2. SLIDE COUNT
10 minutes: 7 main slides plus 1 appendix slide with the pilot method.

3. SLIDE TABLE
| # | Headline | On-slide text | Layout and visual | Notes | Min |
| 1 | Zone picking can speed up every order before busy season | Ask: approve $18,000 today | Title layout, navy headline | State the ask up front. | 1 |
| 2 | Walking is the biggest time sink in picking today | Pickers' top complaint: walking | Simple floor sketch, 4 zones | From picker feedback in the pilot. | 1.5 |
| 3 | We tested zone picking in 1 of our 4 zones for 2 weeks | 2 week pilot, 1 zone | Timeline bar | Same team, same order types. Details in the appendix. | 1 |
| 4 | Pick time per order fell from 6.2 to 4.1 minutes | 6.2 to 4.1 min per order | Bar chart (see chart A) | 2.1 minutes saved, about 34% faster. | 1.5 |
| 5 | Mispicks were cut in half | 1.8% to 0.9% | Bar chart (see chart B) | Source: QA log. | 1.5 |
| 6 | At full rollout this could save about 42 picking hours a day | Estimate: about 42 hours per day | One big number, orange | Estimate if pilot results hold in all zones: 1,200 x 2.1 = 2,520 min = 42 hours. | 1.5 |
| 7 | $18,000 rolls this out before busy season starts in 6 weeks | $18,000: labels + training | Two-column cost and timeline | Half day of training per shift. Ask for the decision. | 2 |
| A1 | How the pilot ran | Pilot method | Text layout | Answer questions only. | 0 |
Total: 1 + 1.5 + 1 + 1.5 + 1.5 + 1.5 + 2 = 10 minutes.

4. CHART SPECS
A) Pick time: 2 bars, "Before" and "Pilot zone", y-axis minutes per order from 0. Labels 6.2 and 4.1. Pilot bar orange #F28C28. Math: 6.2 - 4.1 = 2.1; 2.1 / 6.2 = 0.339, about 34%.
B) Mispicks: 2 bars, y-axis percent from 0. Labels 1.8% and 0.9%, pilot bar orange. Math: 0.9 / 1.8 = 0.5, half.
Source line under each chart: warehouse system report or QA log.

5. BUILD IN GOOGLE SLIDES
- Use the company template: Title layout for slide 1, Title and body for 2, 3, 7, Title only plus an inserted chart for 4 and 5, Big number layout for 6.
- Headlines navy #1F3A5F, one orange #F28C28 highlight per slide, Arial throughout.
- Insert slide numbers; add alt text to the floor sketch and both charts.

6. ACCESSIBILITY CHECK
- Headlines 28 pt or larger, body 18 pt or larger.
- Orange on white is for bars and large numbers only, not small text.
- Bars carry data labels, so meaning does not depend on color.
- Alt text, chart A example: "Bar chart: pick time per order fell from 6.2 minutes before to 4.1 minutes in the pilot zone."

7. REHEARSAL NOTES
- Pause after slide 4 so the 2.1 minute drop lands.
- Likely question: "Will the pilot hold in the other 3 zones?" Answer from your notes: same team and order types in the pilot; the 42 hour figure is an estimate that assumes it does.
- Gap: your notes do not cover the busy season risk plan; add one line on slide 7.