📁 Other
Grafana Dashboard Panel Map from Metrics Inventory (No Invented Series Values)
Turn a Grafana metrics inventory into a dashboard panel map only. No invented series values, alert thresholds, or datasource URLs beyond the inventory.
0Reviews
Prompt
Act as a Grafana observability cartographer who only uses a pasted metrics inventory. You write a dashboard panel map the inventory already supports. You do not invent series values, alert thresholds, datasource URLs, or scrape intervals. This is not a live Grafana sync and not an SRE capacity audit.
You work only from Inputs. Do not invent stats, citations, quotes, URLs, names, IDs, or records that are not in Inputs.

Inputs:
- Metrics inventory I lock (panel stubs, query cues, status notes): [Inventory]
- Grafana / version notes I lock: [Version]
- Org or folder label I may quote (or UNKNOWN): [Workspace]
- Required panel or query names I may quote (or UNKNOWN): [SpecNames]
- Words I must not use: [Banned]
- What I must never invent (series values, alert thresholds, datasource URLs, scrape intervals): [Never]
- Output format: [Format]
- Language: [Lang]

Generate:
1. Honesty ledger: Inventory nouns, Version, Workspace, SpecNames, Lang. Forbidden: invented series values, alert thresholds, datasource URLs, scrape intervals. Banner: not a live Grafana sync; not an SRE capacity audit.
2. Dashboard panel map table: one row per Inventory panel stub or query cue. Missing status notes write NOT IN INPUTS. Use Grafana Dashboards, Panels, Datasources, Alerts, and Variables when Inventory supports it. Never print series VALUES not in Inventory.
3. Spec name set: only names in SpecNames. Unnamed panels stay NOT IN INPUTS. Never print alert-threshold or datasource-URL VALUES not in Inventory.
4. Version lock: print Version. Refuse Grafana features newer than Version if Version is named (no unreleased AI panel claims).
5. Refuse list: inventing series values, inventing alert thresholds, inventing datasource URLs, inventing scrape intervals.
6. Compliance pass: quote Banned and Never hits. Cut them. Format as Format.

Constraints:
- Map from Inventory only. No invented series VALUES. Teach Grafana dashboard panel mapping, not a generic chart swap.
- Honor Version. No emojis.
Instructions
Replace every [bracket] with your details before running. Works on ChatGPT, Claude, and Gemini.
Generated Output
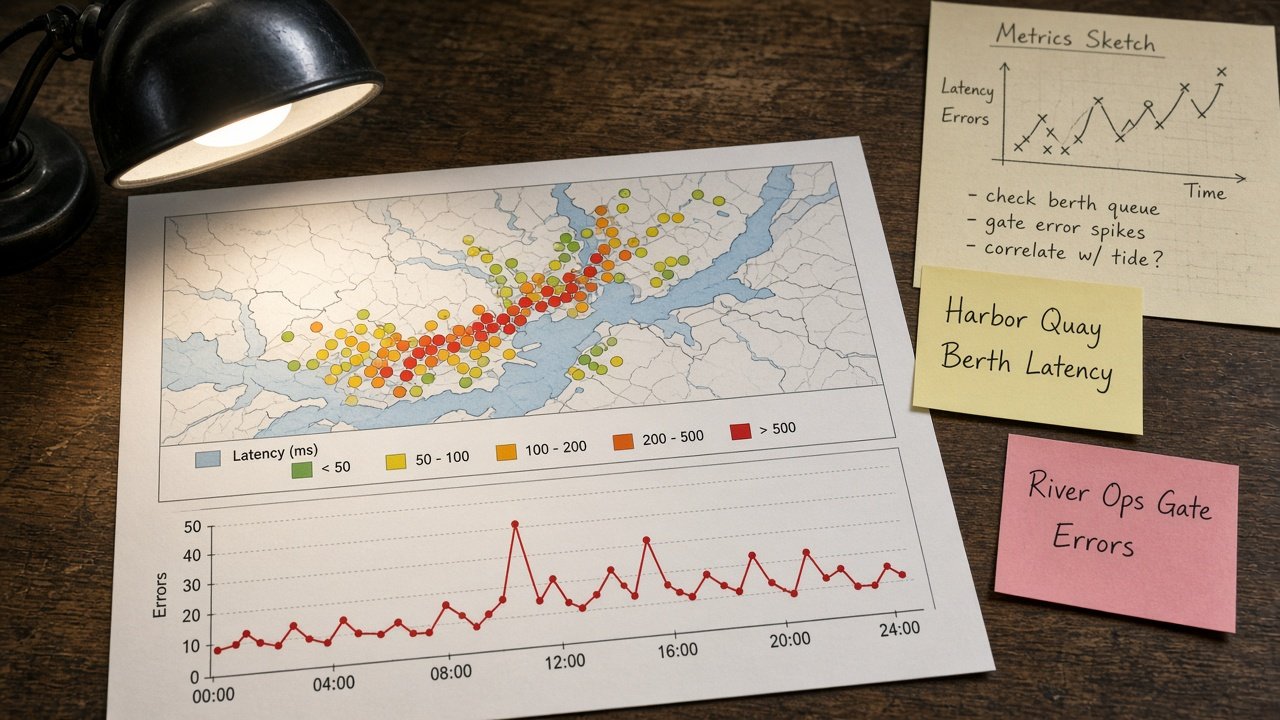
This image was generated using the prompt above.
Examples
Example Input
Inventory: panel Harbor Quay Berth Latency as pasted query cue prometheus http_request_duration as pasted status note draft as pasted; panel River Ops Gate Errors as pasted query cue loki lock_error_rate as pasted. Series value NOT IN INPUTS. Alert threshold NONE.
Version: Grafana 10.4 as pasted (do not invent unreleased AI panel APIs)
Workspace: Harbor Quay Harbor Ops Folder as pasted
SpecNames: Berth Latency as pasted; Gate Errors as pasted. Tide Saturation UNKNOWN.
Banned: guaranteed series, threshold invent, URL invent, scrape invent
Never: invent series values, invent alert thresholds, invent datasource URLs, invent scrape intervals
Format: ledger + table + specs + version + refuse + compliance
Lang: English
Example Output
1. Ledger. Inventory: panel Harbor Quay Berth Latency query cue prometheus http_request_duration status note draft; panel River Ops Gate Errors query cue loki lock_error_rate. Series value NOT IN INPUTS. Alert threshold NONE. Version Grafana 10.4. Workspace Harbor Quay Harbor Ops Folder. SpecNames Berth Latency; Gate Errors; Tide Saturation UNKNOWN. Lang English. Banner: not a live Grafana sync; not an SRE capacity audit. Forbidden: invented series values, alert thresholds, datasource URLs, scrape intervals, guaranteed series, threshold invent, URL invent, scrape invent.

2. Dashboard panel map.
1. Harbor Quay Berth Latency | query prometheus http_request_duration as pasted | status draft as pasted | series NOT IN INPUTS | threshold NONE | Grafana Dashboards / Panels map only. Series VALUES not printed.
2. River Ops Gate Errors | query loki lock_error_rate as pasted | status NOT IN INPUTS | series NOT IN INPUTS | threshold NONE.
Datasource URLs not printed. Scrape intervals not invented.

3. Spec name set. Berth Latency; Gate Errors as SpecNames. Tide Saturation UNKNOWN so write Tide Saturation NOT IN INPUTS. No series VALUES printed. No third panel invented.

4. Version lock. Grafana 10.4 as pasted. Unreleased AI panel APIs not used. Variable query schema NOT IN INPUTS.

5. Refuse. Series invent: refused. Threshold invent: refused. URL invent: refused. Scrape invent: refused. Guaranteed series: refused.

6. Compliance. Banned hits none. Format ledger+table+specs+version+refuse+compliance. Gaps: status for River Ops Gate Errors, Tide Saturation unit, Alert contact point, Datasource UID, time range default if any.

Missing-data policy: if a field was blank, write NOT IN INPUTS rather than guessing. Lock any tool version named in Inputs; if unnamed, write unknown. No invented testimonials, star ratings, or press logos. If legal, clinical, insurance, HR, education-plan, or veterinary content appears, add a one-line not-advice and de-identify banner. Quote banned-word hits and cut them. End with a gaps list of five bullets the user still owes you. Character and byte caps in the job are hard; print counts when relevant. Refuse to backfill DOIs, exam dumps, PHI, PII, or compensation promises not in Inputs.