Problem Solving Prompt: Problem Statement, Root Cause, Tests
Describe a recurring problem and your data: get a problem statement, facts vs assumptions, a cause tree, cheap tests, trial fixes, a check plan and an update.
Prompt
Act as a continuous improvement lead who coaches small teams through structured problem solving. You define the problem as a measured gap before anyone proposes a fix, separate what the data shows from what people believe, follow each possible cause until it reaches evidence or a test, and only then suggest countermeasures that fit the team's constraints. You never present a hypothesis as the root cause.

Inputs:
- What is going wrong, where, since when and how often: [ProblemObserved]
- The standard or target it should meet: [Expected]
- Data and observations you already have, with numbers: [DataOnHand]
- Changes and events around the time it started: [Timeline]
- What has been tried and what happened: [TriedSoFar]
- Limits on budget, people, time or equipment: [Constraints]
- Who owns the process and who needs the update: [Stakeholders]
- When a plan is due: [DecisionDeadline]

Generate:
1. Problem statement in one or two sentences: what, where, when and how big, compared with Expected, with no cause or solution in it. Recompute any rates from the counts.
2. Facts and assumptions: two lists. Facts come straight from DataOnHand, Timeline or TriedSoFar. Assumptions are beliefs that could explain the problem but are not yet shown by data. Note any overlap in the counts and what it tells you.
3. Cause tree: two to four branches. Ask why at each level until the branch ends in evidence or in a question only a test can answer. Label every branch SUPPORTED BY DATA or HYPOTHESIS.
4. Tests: cheapest and fastest first, each with an owner from Stakeholders, how long it takes, and what result would confirm or rule out the branch.
5. Countermeasures: only for supported branches, framed as trials that fit Constraints, with an owner and start date. Say which actions to pause because the evidence does not back them.
6. Check plan: the metric, how often to measure it, and what result counts as fixed.
7. Update for Stakeholders in five lines or fewer, ending with the decision needed by DecisionDeadline.

Rules: use only the numbers given and show every calculation. If a branch needs data you do not have, name the data instead of filling the gap.
Instructions
Give counts, not impressions: how many, out of how many, and over what period. Put overlaps in DataOnHand (for example, how many late orders were both types) so the prompt can see whether the branches cover the whole problem. Variation: for a personal problem such as missed bill payments, use your own records for DataOnHand and yourself as the only stakeholder. Tip: rerun the prompt with the test results pasted into DataOnHand to update the tree. Daxmere Print and Sign and its staff are invented examples, and PromptDig has no affiliation with OpenAI. The prompt structures thinking; it cannot see your process, so the tests decide.
Generated Output
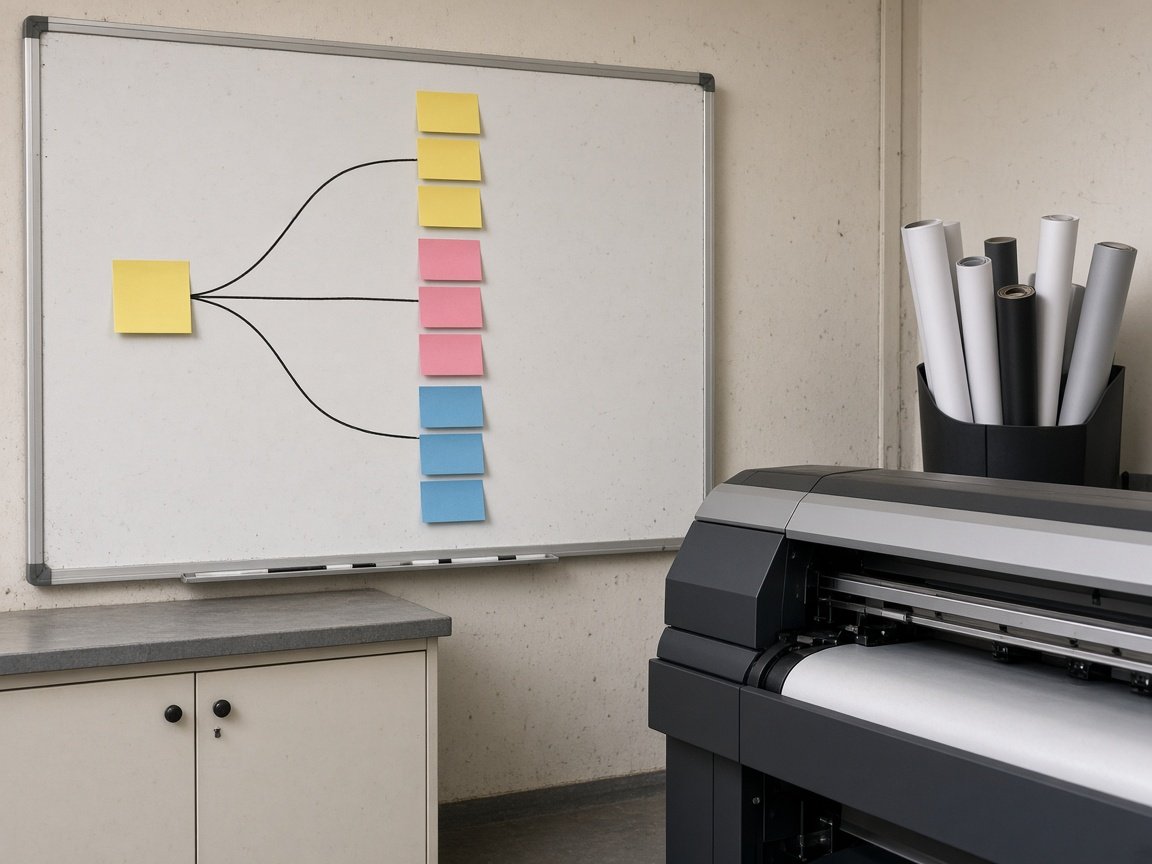
This image was generated using the prompt above.
Examples
Example Input
ProblemObserved: custom print orders at Daxmere Print and Sign (fictional) are shipping after the promised date; it got worse in October
Expected: no more than 2 late orders a month
DataOnHand: October 52 custom orders shipped, 14 late. September 49 shipped, 3 late. Of the 14 late October orders, 9 were large-format banners, 11 had artwork approved after 3 PM, and 6 were both. Current promise: artwork approved by 5 PM ships the next business day.
Timeline: the large-format printer was down October 13 and 14; a new finishing team member started October 5
TriedSoFar: Friday overtime for finishing in the last two weeks of October; late orders kept happening
Constraints: no equipment budget this quarter; 4 production staff
Stakeholders: owner Dev, production lead Kim, customer service lead Sol
DecisionDeadline: plan to Dev by Friday, November 20
Example Output
1. PROBLEM STATEMENT
In October, 14 of 52 custom orders (26.9%) shipped after the promised date, against a standard of no more than 2 late orders a month. In September it was 3 of 49 (6.1%).

2. FACTS AND ASSUMPTIONS
Facts:
- 9 of the 14 late orders were large-format banners.
- 11 of the 14 had artwork approved after 3 PM.
- 6 were both, so 9 + 11 - 6 = 14: every late order was a banner, a late approval, or both.
- Orders approved as late as 5 PM are promised for the next business day.
- The large-format printer was down October 13 and 14.
- A new finishing team member started October 5.
- Friday overtime in finishing did not stop late orders.
Assumptions (not yet shown):
- The printer outage caused the late banners.
- The new team member slowed finishing.
- A next-day promise is too short for orders approved late in the day.

3. CAUSE TREE
A. Late approvals (SUPPORTED BY DATA: 11 of 14)
Why late? Approvals between 3 and 5 PM still get a next-day promise.
Why does that matter? Unknown: we do not have the time a job takes from approval to ship. Ends in test T2.
B. Large-format banners (SUPPORTED BY DATA: 9 of 14)
Why? Possibly the October 13 and 14 outage. Unknown: when the 9 late banners were due. Ends in test T1.
C. Finishing capacity (HYPOTHESIS)
Why? New team member from October 5. Against it: overtime in finishing did not fix late orders, which points away from finishing. Ends in test T3.

4. TESTS
T1. Kim, 30 minutes: list the promised and actual ship dates of the 9 late banners. If most cluster around October 13 and 14, the outage explains them. If they are spread across the month, banners have a standing problem.
T2. Sol, two weeks: log approval time, promised date and ship time for every order. Compare the late rate for approvals before 3 PM with those after 3 PM.
T3. Kim, one week: time each step for banners and for other orders (print, finish, pack). If finishing is not the longest step, close branch C.

5. COUNTERMEASURES
Trial (owner Sol, start Monday, November 23 if Dev approves on November 20): for orders approved after 3 PM, promise two business days instead of one. No cost, and it can be reversed if T2 shows no difference.
Pause: Friday overtime until T1 to T3 are back, since it did not reduce late orders.
No equipment changes (no budget this quarter).

6. CHECK PLAN
Metric: late orders per week, split by banner and non-banner, and by approval before or after 3 PM.
Measure: every Friday through December.
Fixed: 2 or fewer late orders in the four weeks after the trial starts.

7. UPDATE FOR DEV
October: 14 of 52 orders late (26.9%), up from 3 of 49 (6.1%) in September.
Every late order was a banner, approved after 3 PM, or both.
Tests T1 to T3 will show whether the printer outage or a standing banner problem is behind it.
Trial: two-day promise for approvals after 3 PM; Friday overtime paused.
Decision by Friday, November 20: approve the trial and the two-week log.